
Mastering Meta Trader 5/Trading View – Tutorial
1. MetaTrader 5 Tutorial: Learn platform setup, chart tools, order types, and trade management. 2. TradingView Indicators: Use advanced indicators, custom alerts, and community scripts for smart analysis. 3. Meta Account Creation: Create, verify, and connect your broker account to …

Overview
1. MetaTrader 5 Tutorial: Learn platform setup, chart tools, order types, and trade management.
2. TradingView Indicators: Use advanced indicators, custom alerts, and community scripts for smart analysis.
3. Meta Account Creation: Create, verify, and connect your broker account to MT5 for live or demo trading.
Curriculum
- 1 Section
- 5 Lessons
- 10 Weeks
- Mastering Meta Trader 5/Trading5
- 1.1Account Creation & Setup Step-by-step guide to create demo and live accounts. Connecting brokers to MetaTrader 5 and TradingView. Setting up leverage, base currency, and server details. Mobile and desktop synchronization for smooth trading access.
- 1.2Platform Interface & Toolbars Complete overview of main toolbars and chart panels. Using drawing tools (trendline, Fibonacci, horizontal line, rectangle, channels). Setting up profiles, templates, and chart styles (candlestick, bar, line). Managing watchlists, alerts, and order execution tools.
- 1.3Line Studies & Timeframes Understanding and applying line studies: Trend lines Support & resistance Fibonacci retracement/extension Pitchfork & Gann tools Multi-timeframe analysis: from 1-minute scalping to 1-month swing setups. Identifying market structure consistency across multiple timeframes.
- 1.4Indicators & Their Categories A. Volume Indicators Volume – measures buying/selling strength. On-Balance Volume (OBV) – confirms trend strength. Volume Profile – shows traded volume at price levels (institutional zones). Accumulation/Distribution Line (A/D) – detects smart money flow. B. Trend Indicators Moving Averages (SMA, EMA) – identifies direction and momentum. MACD (Moving Average Convergence Divergence) – trend confirmation and crossover signals. Parabolic SAR – trailing indicator for entry and exit timing. ADX (Average Directional Index) – measures trend strength. C. Volatility Indicators Bollinger Bands – shows volatility expansion and contraction. ATR (Average True Range) – measures market volatility for stop-loss placement. Donchian Channels – breakout and volatility range indicator. D. Oscillator Indicators RSI (Relative Strength Index) – identifies overbought/oversold zones. Stochastic Oscillator – confirms short-term reversals. CCI (Commodity Channel Index) – detects market extremes. Momentum Indicator – measures speed and change of price movement.
- 1.5Practical Integration Combining multiple indicator types for confluence-based setups. Customizing and saving indicator templates. Real-time analysis using TradingView scripts and MT5 Expert Advisors (EAs).
Instructor
You May Like


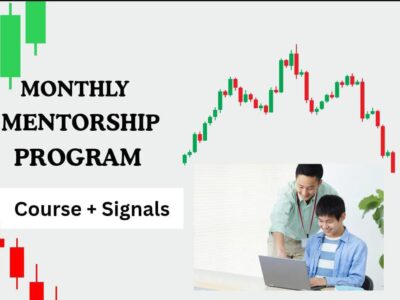
Monthly mentorship program
We are offering a comprehensive learning and trading package designed for individuals who want to enhance their financial market skills while benefiting from real-time trading...

Private Mentor Ship
Master the art of market analysis with a deep dive into powerful trading theories and techniques

Price Action – Basic Course – Zoom Classes
Price action trading focuses on reading raw price movements without relying on heavy indicators. It starts with understanding market structure, including trends, support, resistance, and...

(SMC) smart money concept theory
Price Action Advance Course with Smart Money Concepts (SMC) focuses on understanding how institutional traders move the market. One of the key concepts is the...
")
Course Features
- Lectures 5
- Quiz 0
- Duration 54 hours
- Skill level All levels
- Language English
- Students 29
- Assessments Yes